
Last updated: July 6, 2020
Math Skill: Interpreting bar graph and using ordinal numbers
Science Area: Pollution / Weather and Climate
Area level: National-scale
Environmental Area: Air / Climate change
Purpose: Understand Indiana as one of the highest CO2-emitting state in the United States and develop awareness of greenhouse gas emissions
BACKGROUND FOR THE TEACHER
In 2018, the United States emitted 5.28 billion metric tons of CO2 (European Commission, 2019). It ranked second in the world after China. China and our nation are the world’s two largest CO2 emitting countries, and both are responsible for 44% of the total CO2 emissions in the world.
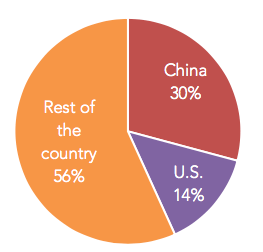
World CO2Emissions by Country, 2018 (Source: European Commission, 2019)
The amount of CO2emissions has increased in our country during 1990 and 2008 due to the increase of fossil fuel combustion to meet our energy demands. We saw a significant drop in 2009, attributable to the fact that energy consumption declined due to the economic recession that started in 2008.
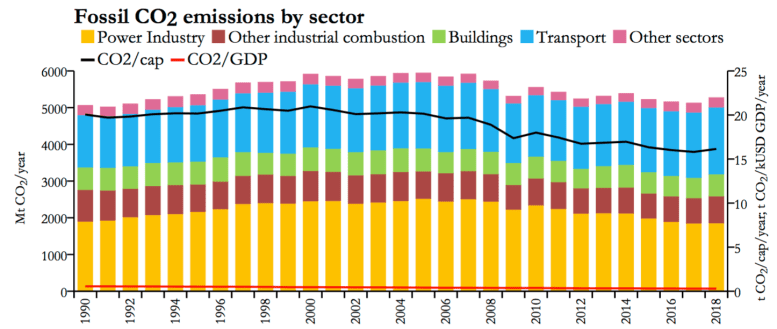
CO2 Emission Trends in the U.S. (Source: European Commission, 2019)
Transportation and electric power sectors are the two major sources of CO2 emissions in our nation (EIA, Table 4).

CO2 emissions by sector in the United States, 2017 (EIA, Table 4)
TEACHER GUIDE
The purpose of this activity is to improve students’ skills in interpreting bar graphs by using graphs of 1) the 10 largest CO2- emitting states in our nation as of 2017and 2) the amount of CO2emissions in 12 states of the Midwest as of 2017. Through reading the graphs, students will get the idea that Indiana is one of the largest CO2 – emitting states in the United States. Both graphs are created based on the data obtained from the U.S. Energy Information Administration (U.S. EIA).
worksheet & answer key
Math Skill: Interpreting bar graph and using ordinal numbers
- This bar graphs shows the 10 largest CO2 emitting states in our nation in 2017. Students are asked to solve questions related to the bar graph. Students will use ordinal numbers to answer questions.


2. Midwest Version
This bar graphs shows the amount of CO2emissions in 12 states in the Midwest in 2017.Students are asked to solve questions related to the bar graph. Students will use ordinal numbers to answer questions.


