
Last updated: July 6, 2020
Math Skill: Bar Graphs
Science Area: Pollution / Weather and Climate
Grade level: 2nd, 3rd, 4th grades
Environmental Area: Water
Purpose: Develop awareness of climate change while strengthening skills of interpreting bar graphs
BACKGROUND FOR THE TEACHER
Climate scientists point out that the increased amount of greenhouse gas emissions in the atmosphere has led to climate change. A study from NASA showed that, since the Industrial Revolution began in about 1750, carbon dioxide, one of the major greenhouse gases, increased by 38%, while methane, another major greenhouse gas, increased by 148%.

Source: NASA, Global Warming
Carbon dioxide can be produced from a variety of human activities, such as burning fossil fuels for energy generation, transportation, heating buildings, cutting down carbon-absorbing forests for agriculture, and disposing of waste in landfills. Most of our daily activities such as watching TV, cooking, commuting to school, and taking a shower, are also associated with increasing the amount of carbon dioxide emissions in the atmosphere.
Climate change and Greenhouse Gas Effect


TEACHER GUIDE
The purpose of this activity is to improve students’ skills in data analysis through creating and interpreting bar graphs while giving them the idea that many activities they do at home contribute to carbon dioxide emissions and climate change. This activity is created based on data obtained from Department of Energy and U.S. Energy Information Administration.
Worksheet & answer key
Math Skill: Bar Graphs
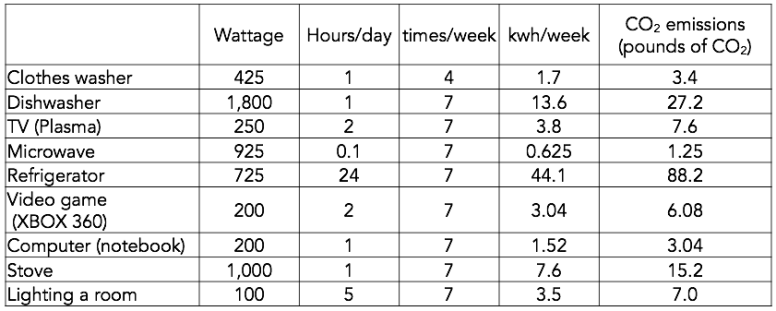
This chart compares the amount of CO2emitted from typical household activities in a week. One [CO2] represents 1 pounds of CO2/year. Using this chart, students are asked to create a bar graph and arrange the activities in order starting with the one that creates most CO2in the house.


